Curriculet Data Project
User Experience User Research Visual Design Product Management
Introduction

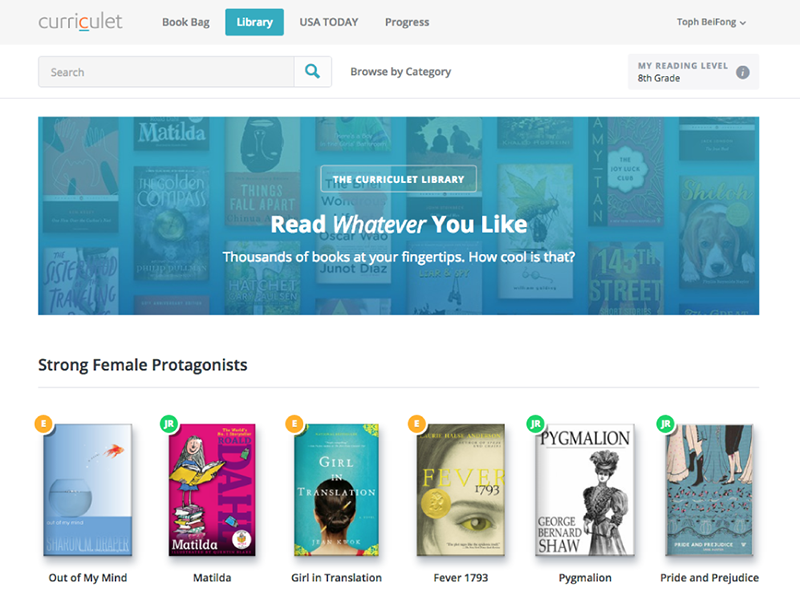
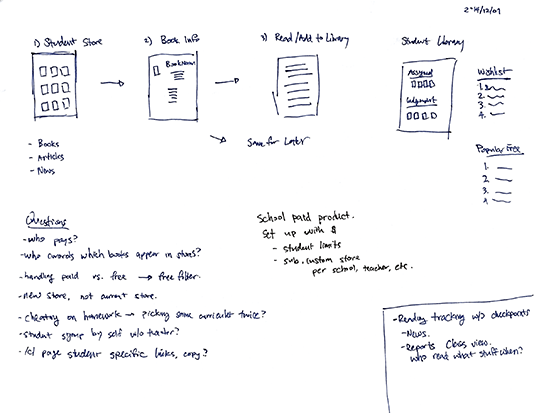
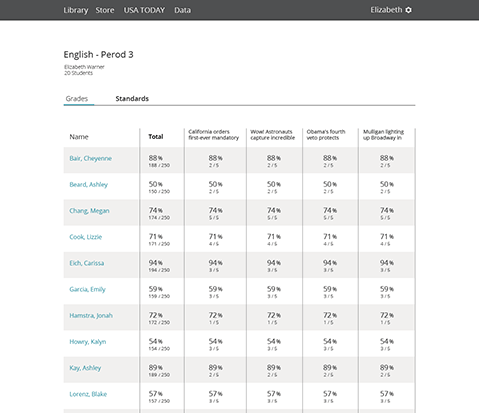
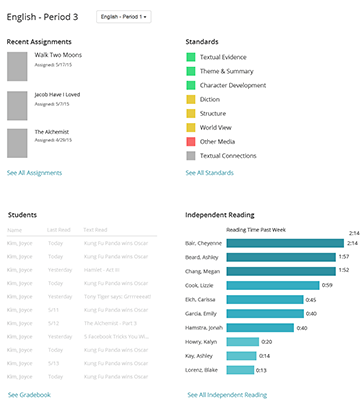
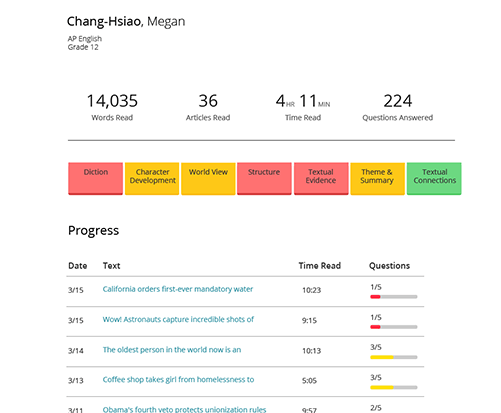
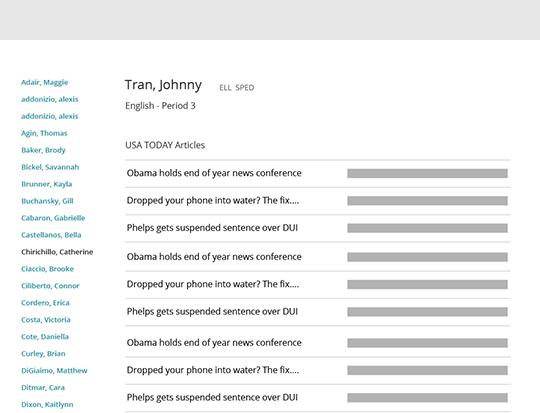
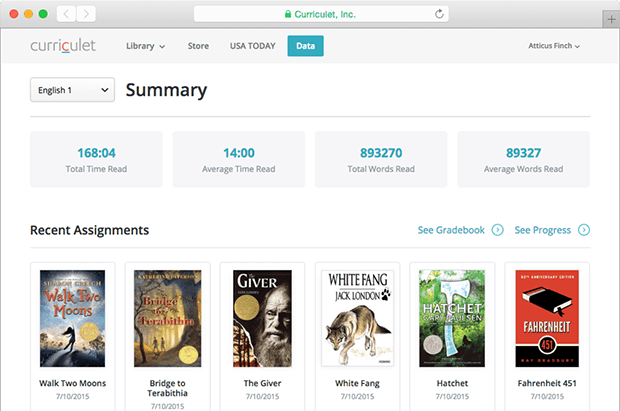
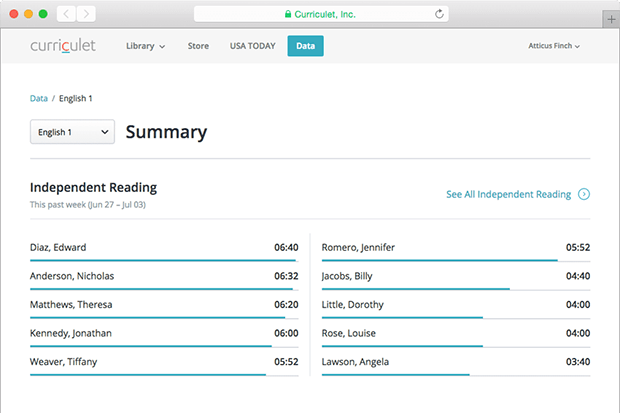
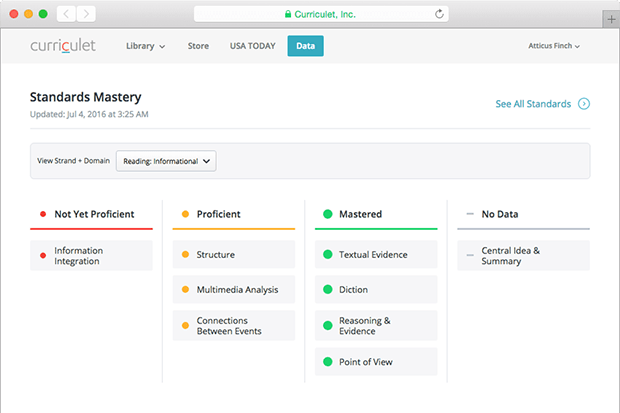
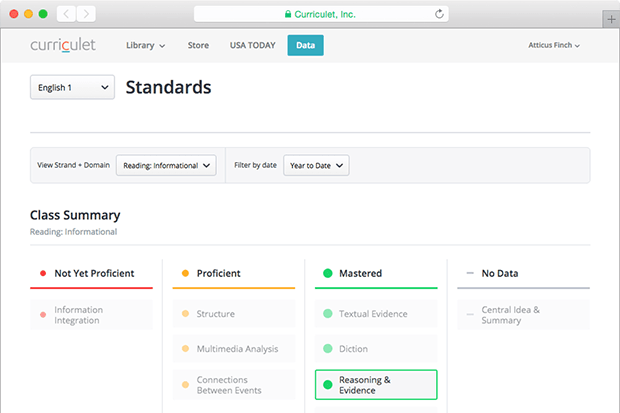
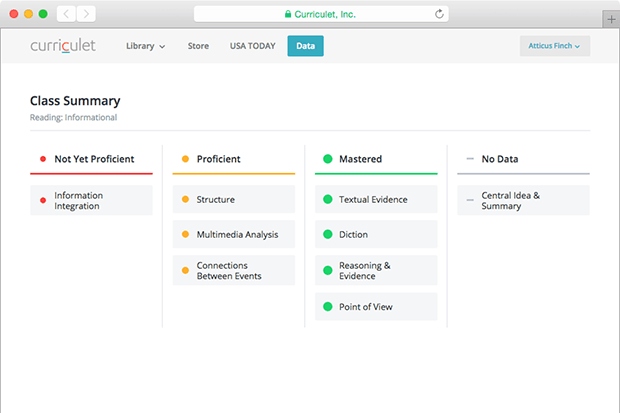
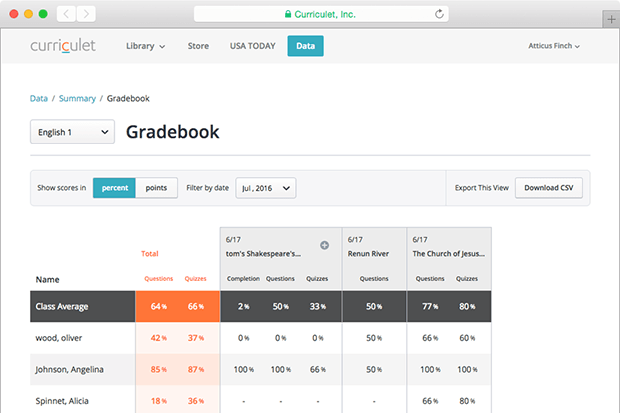
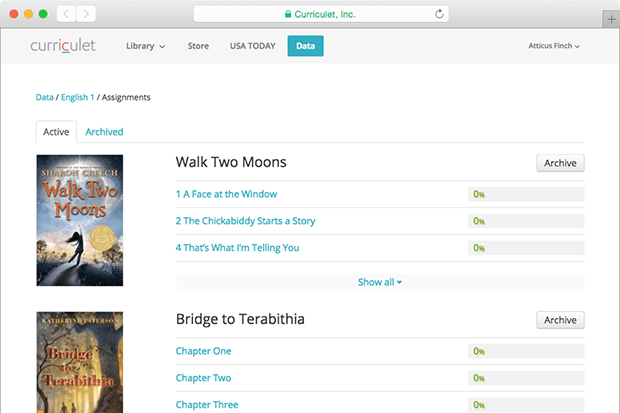
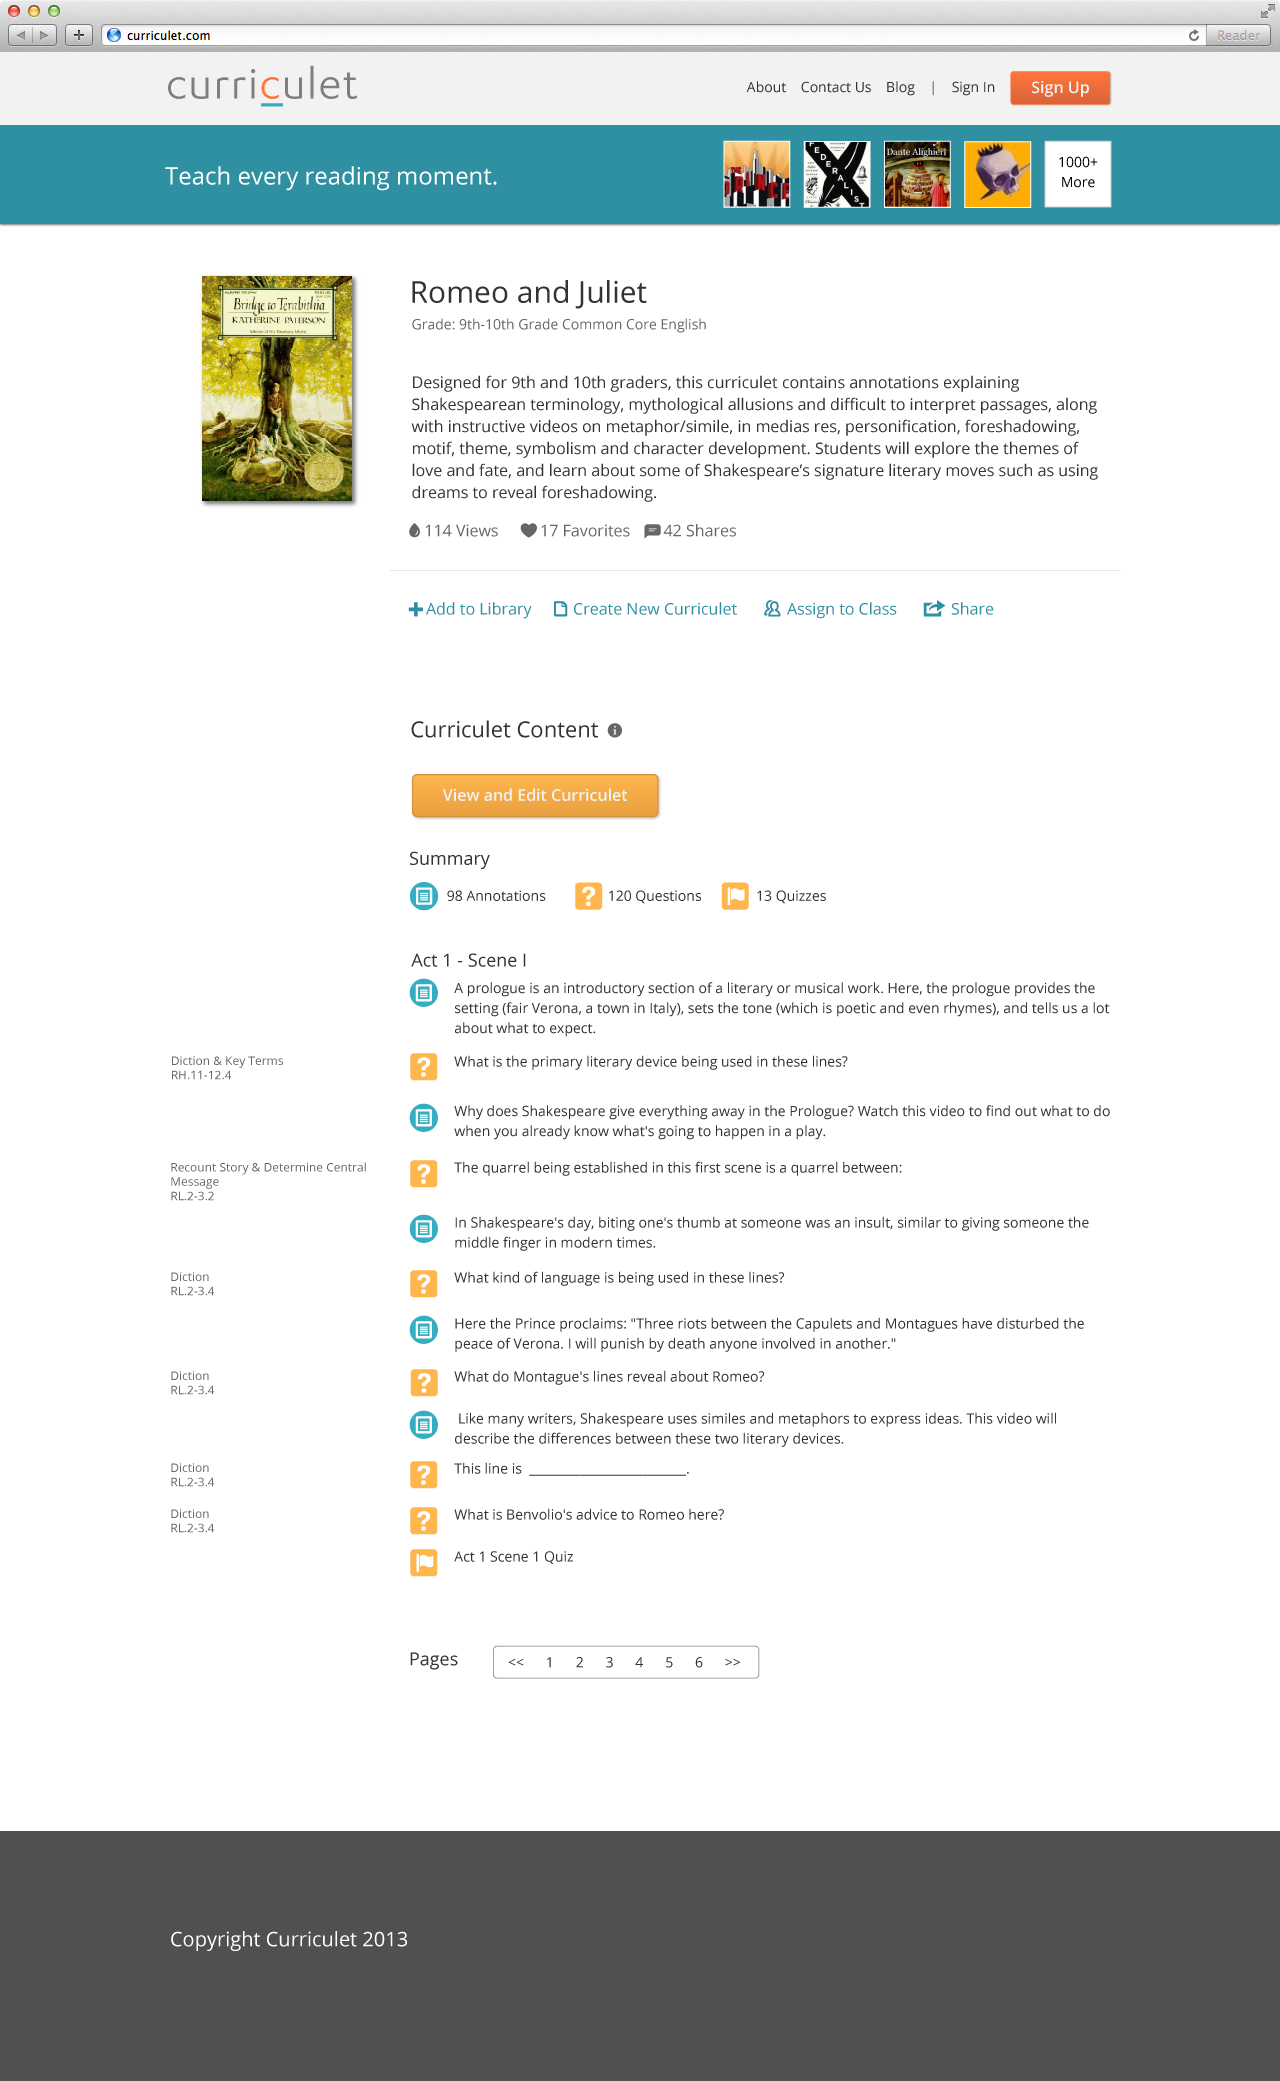
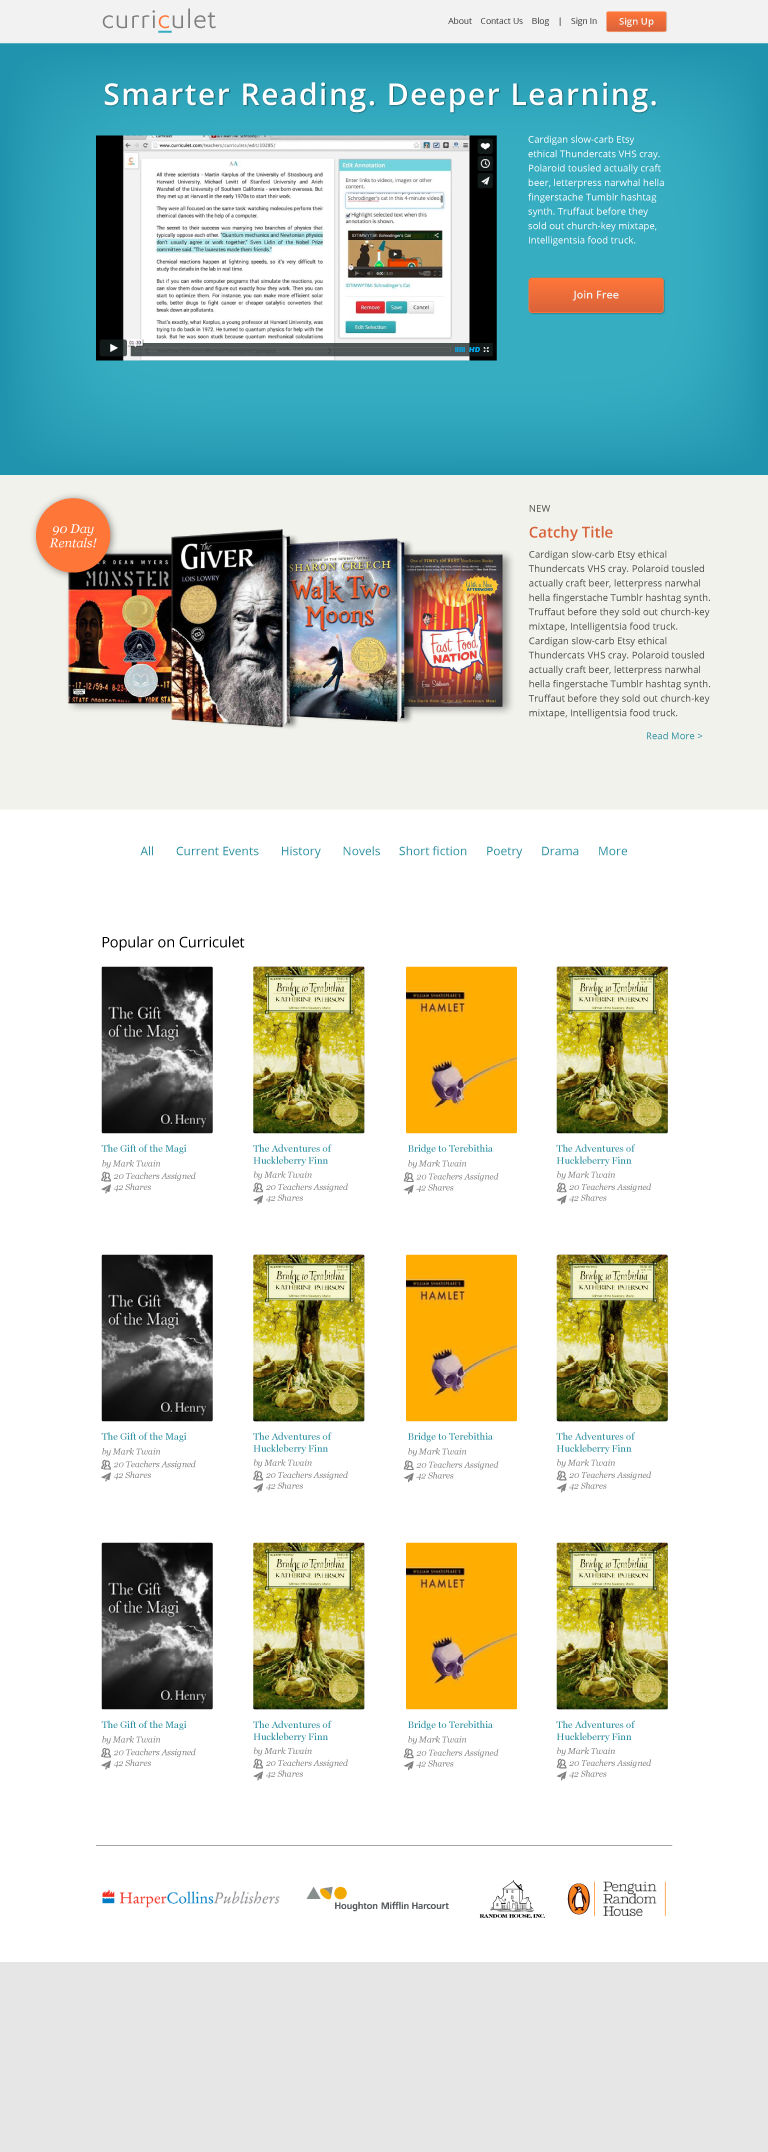
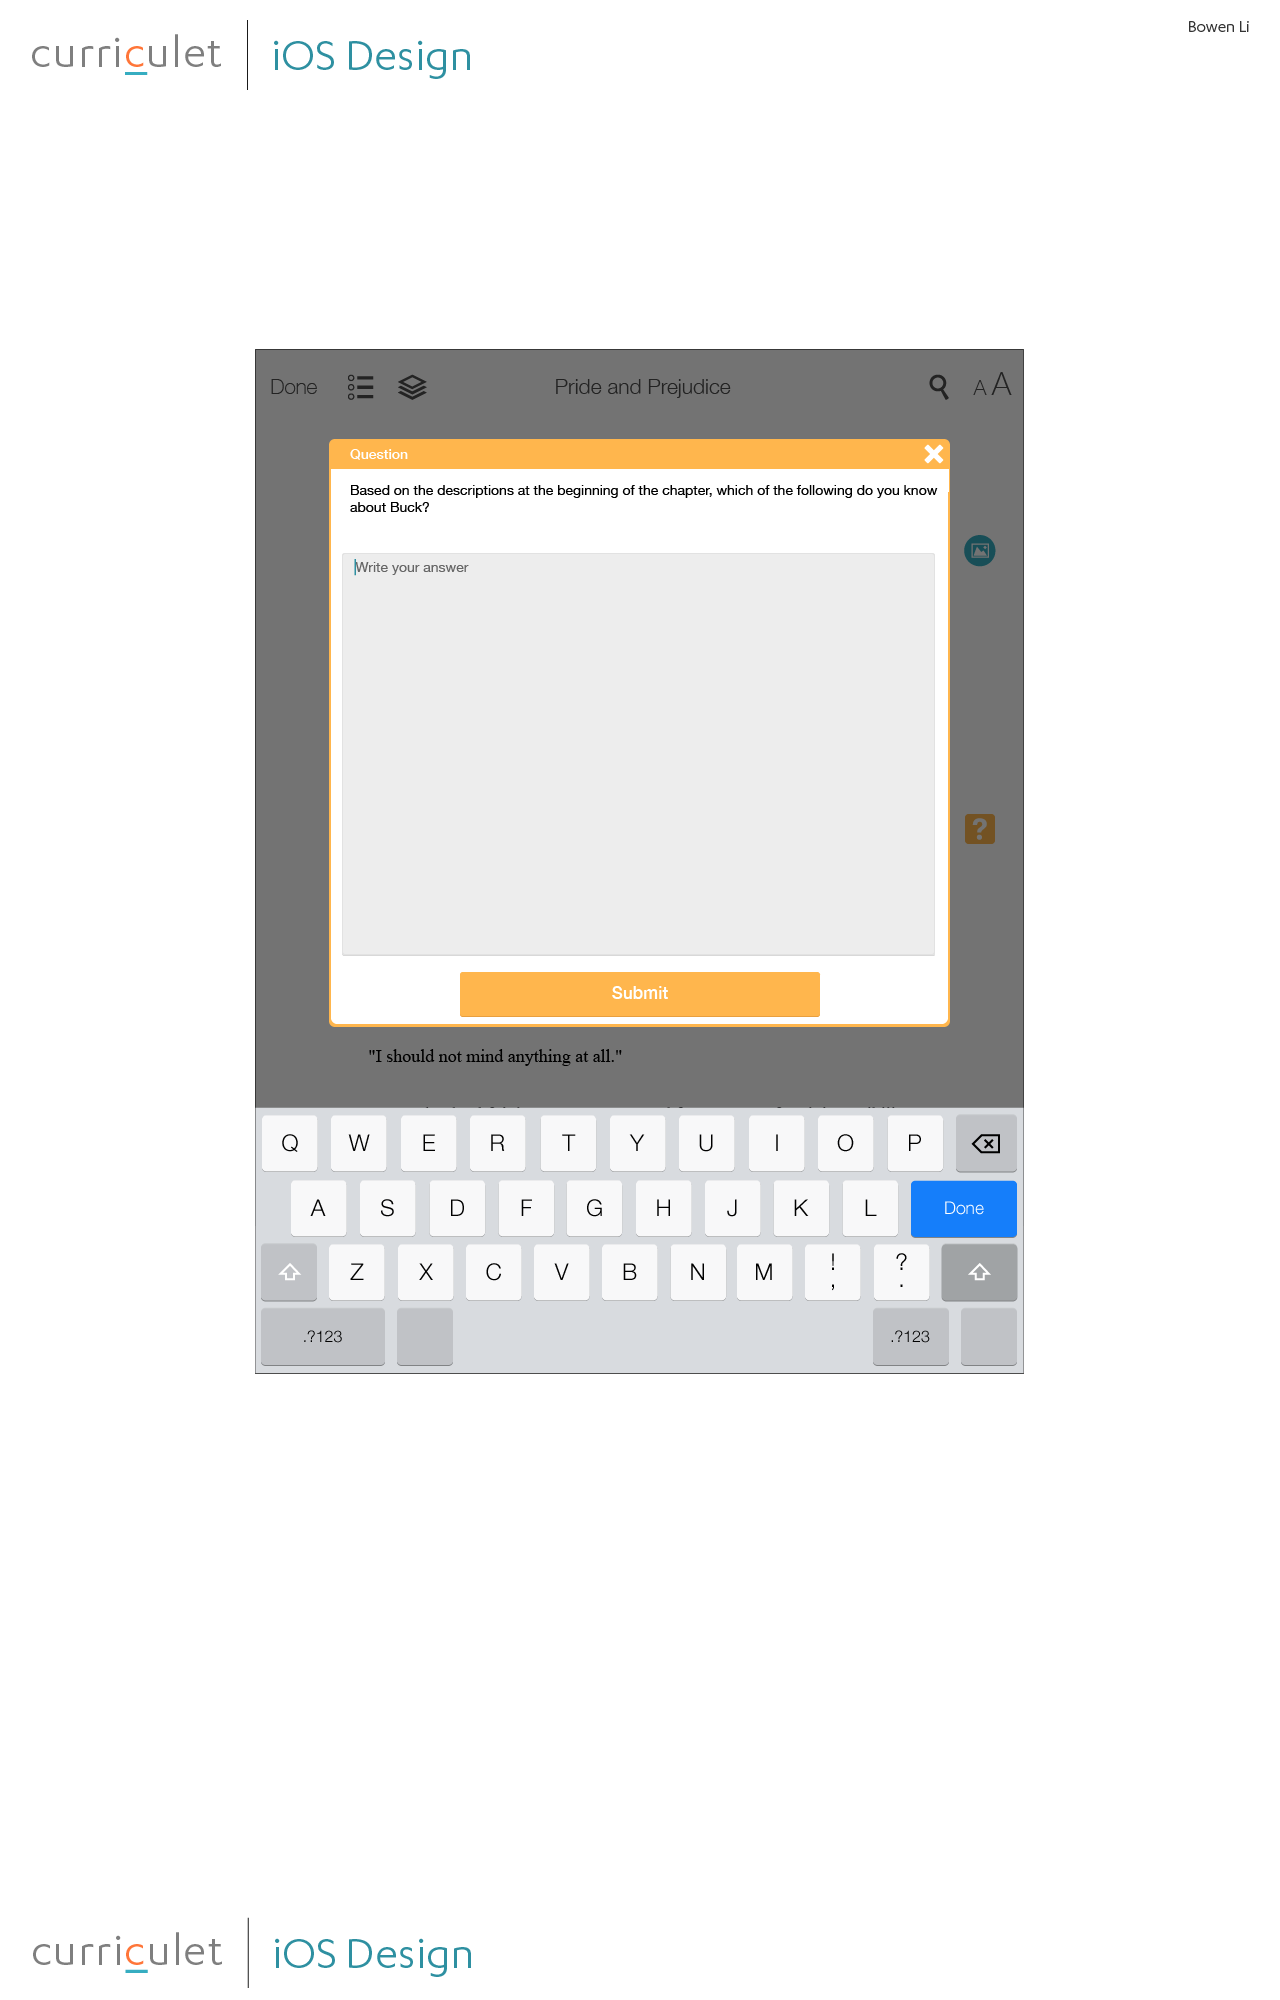
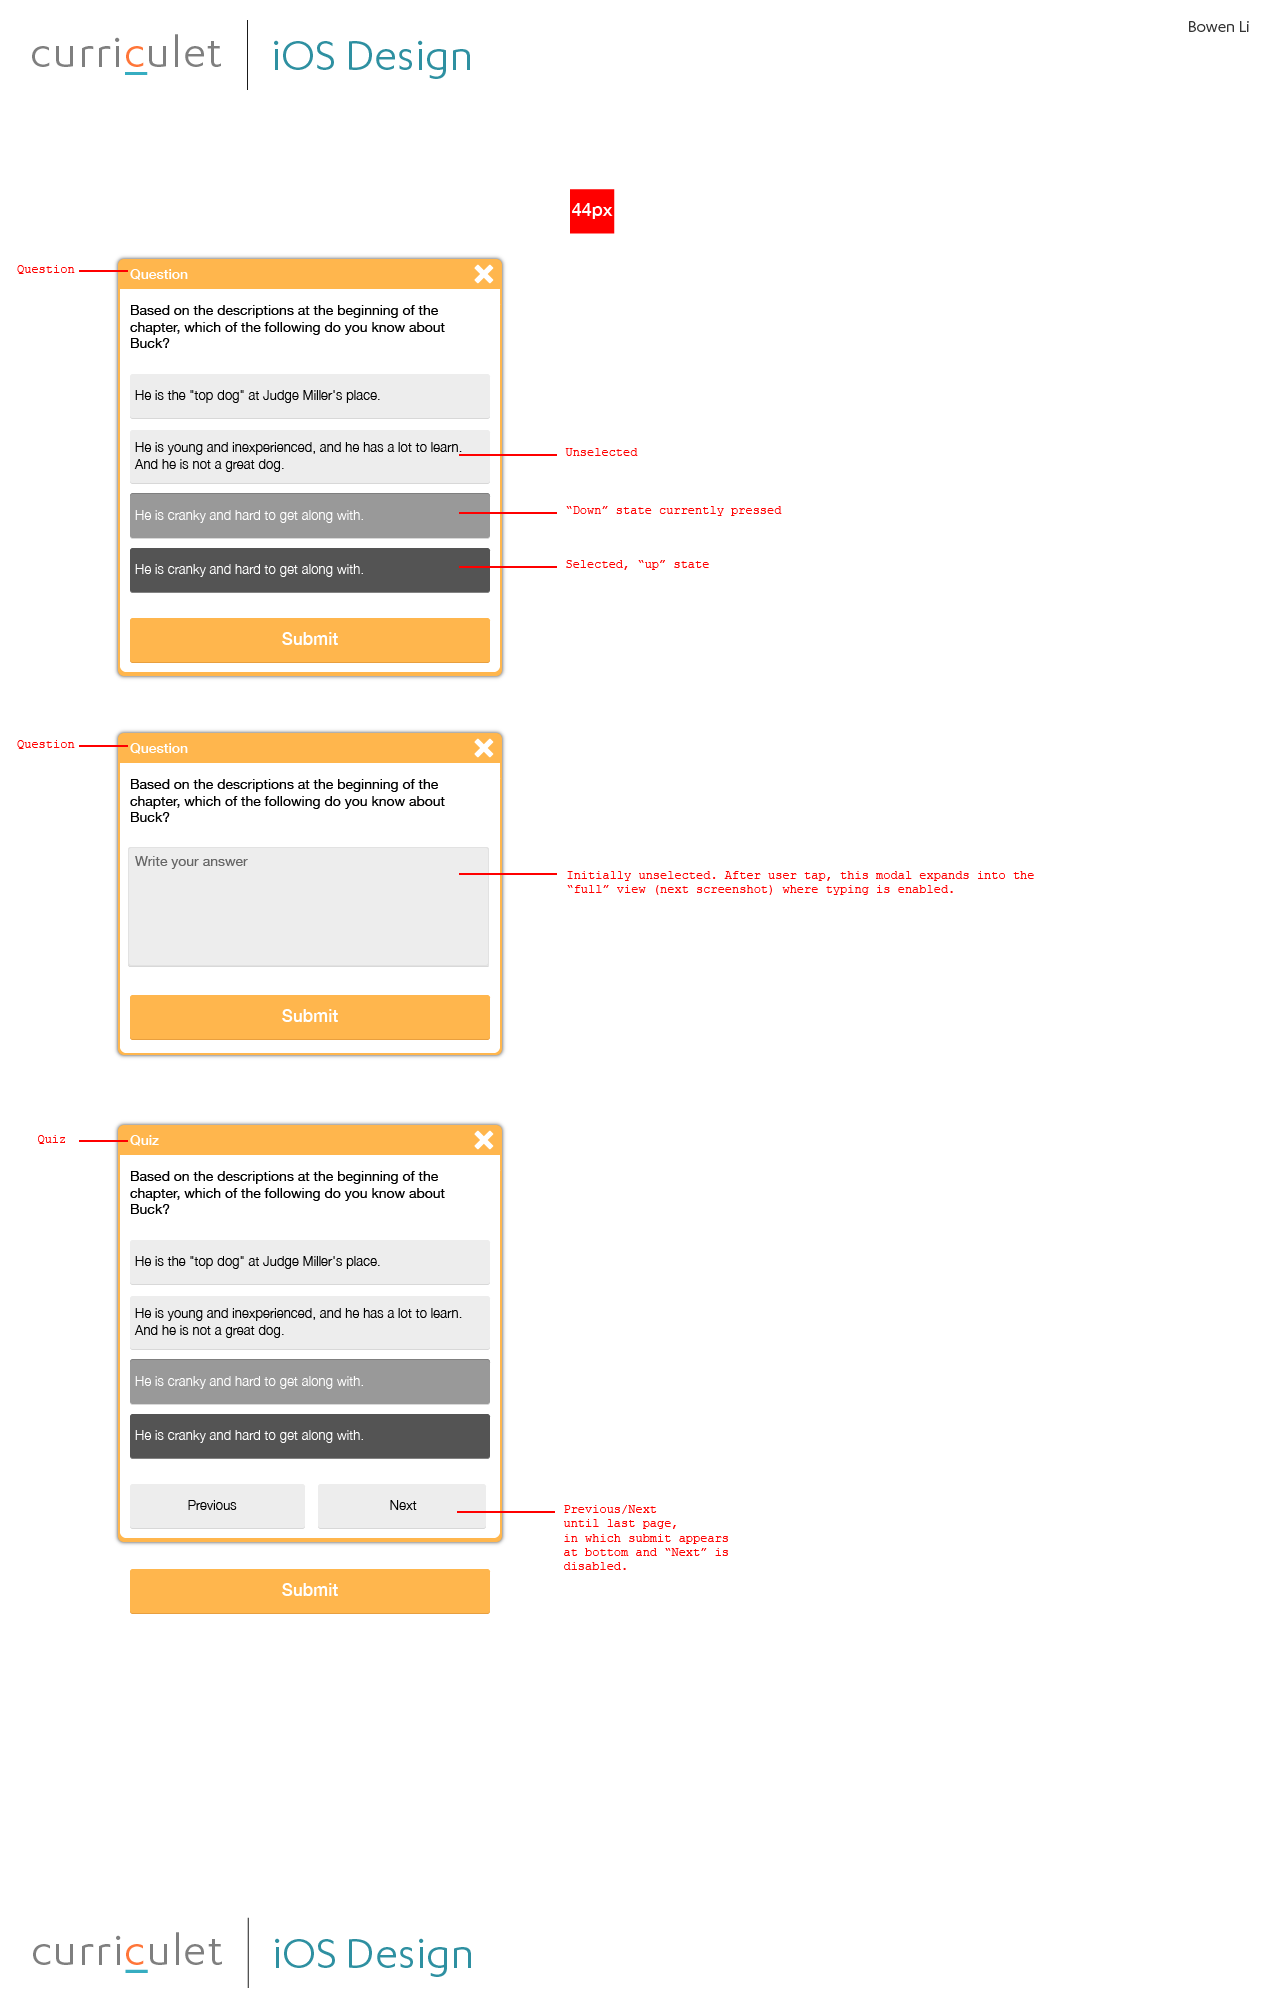
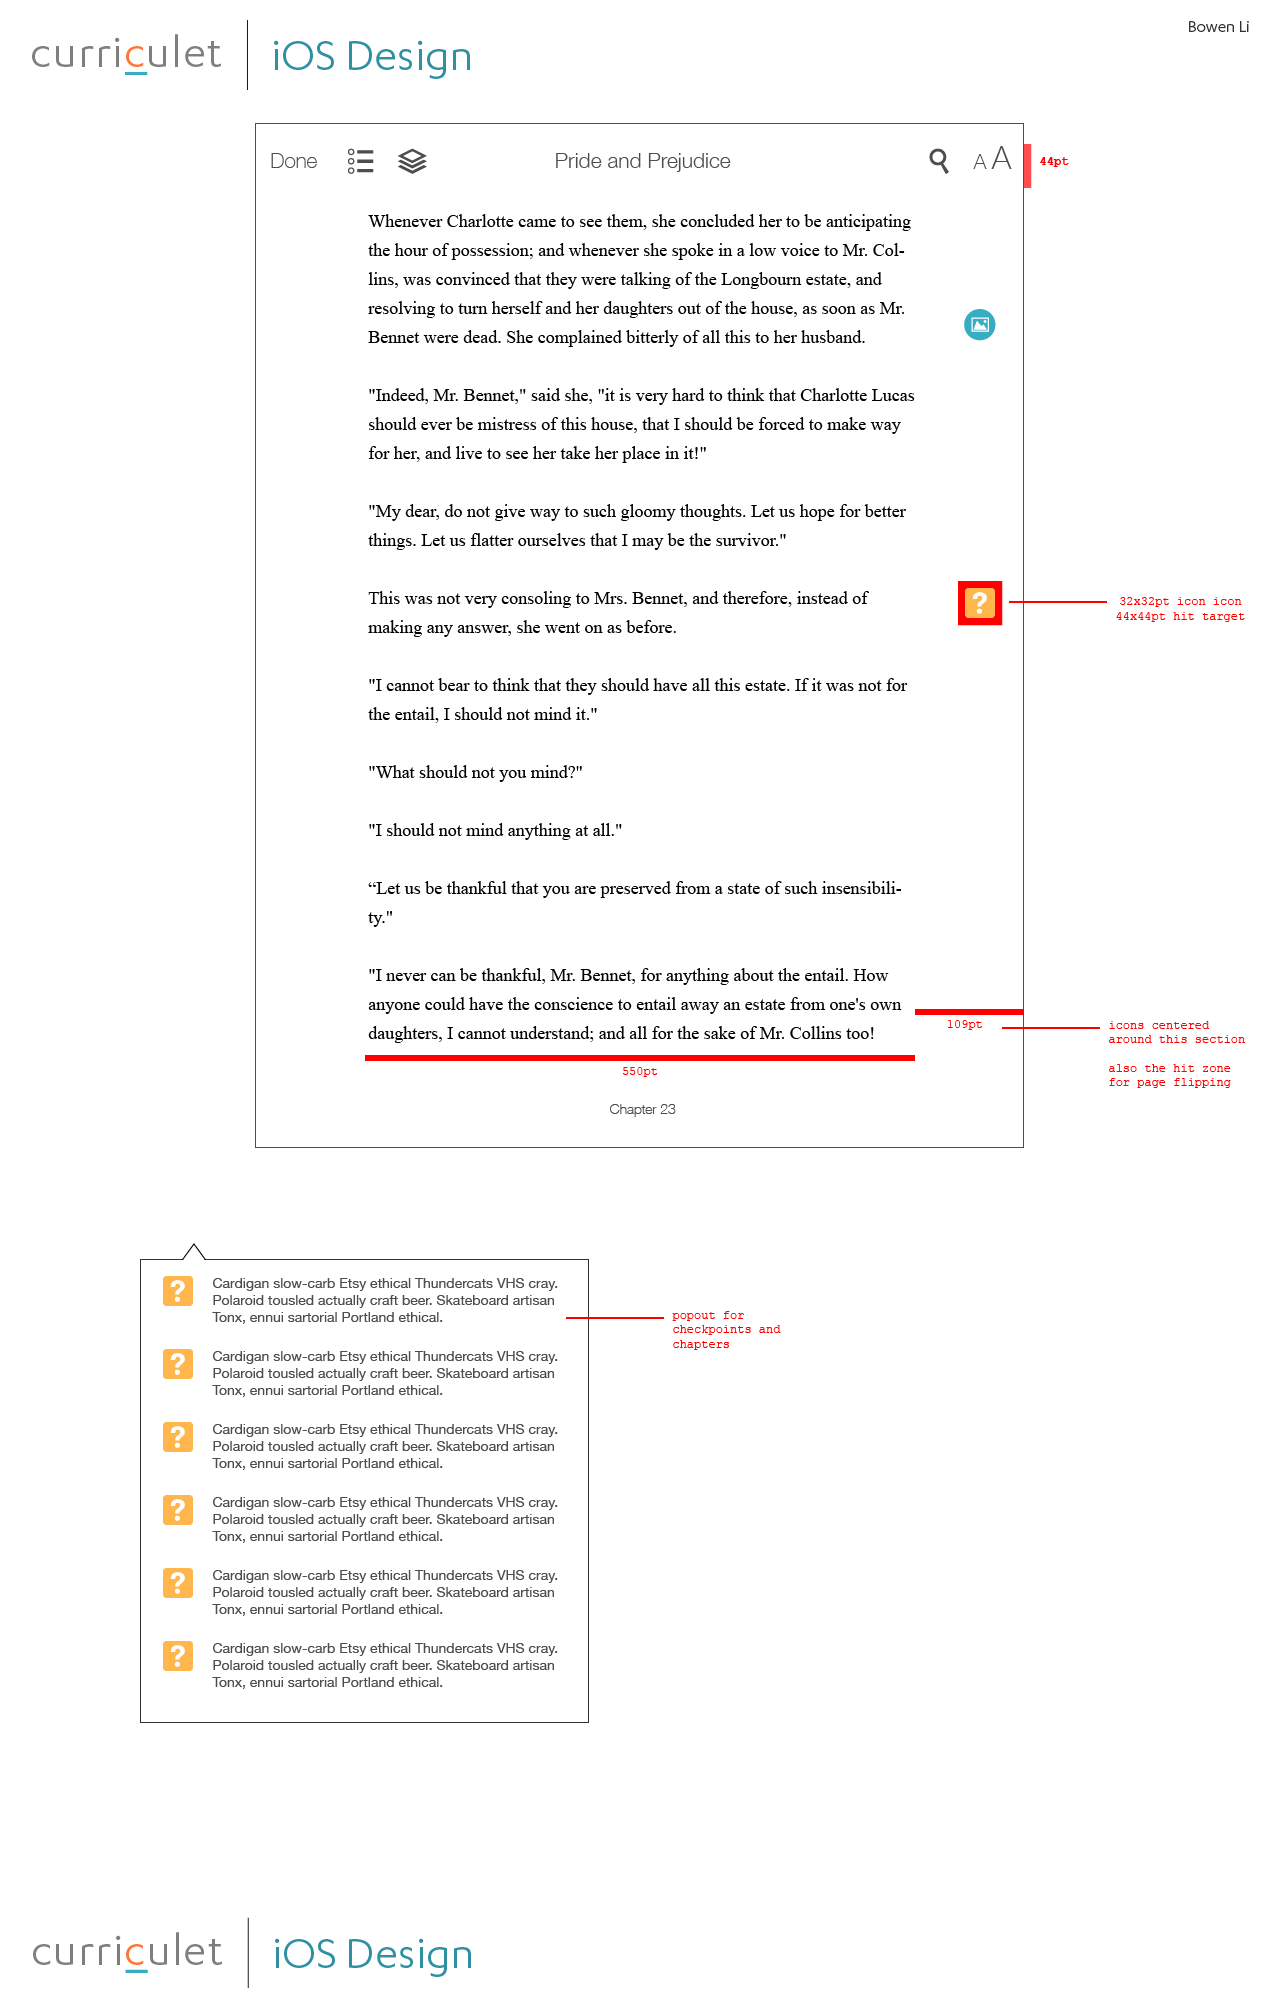
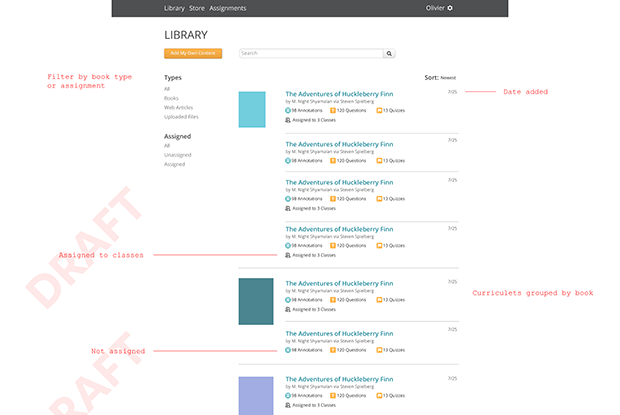
Curriculet is a digital reading platform that allows English teachers to teach full length books, news articles, and rich web media with curriculum embedded inside the reading. It tracks student progress and assesses student competency through the national educational standards for reading comprehension.

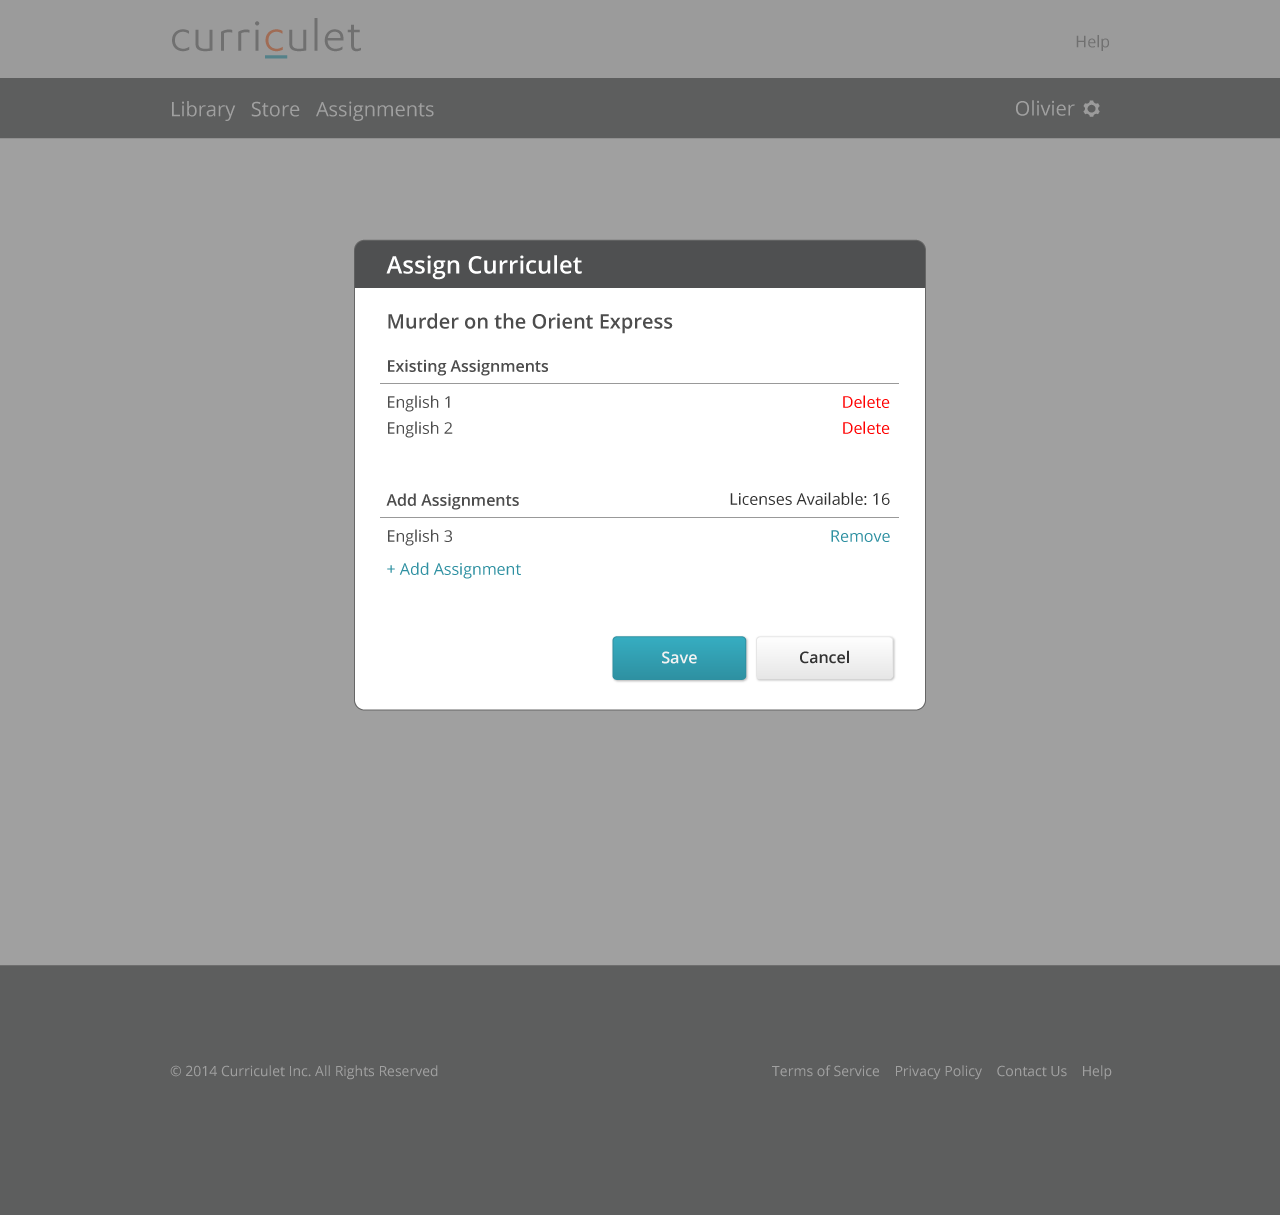
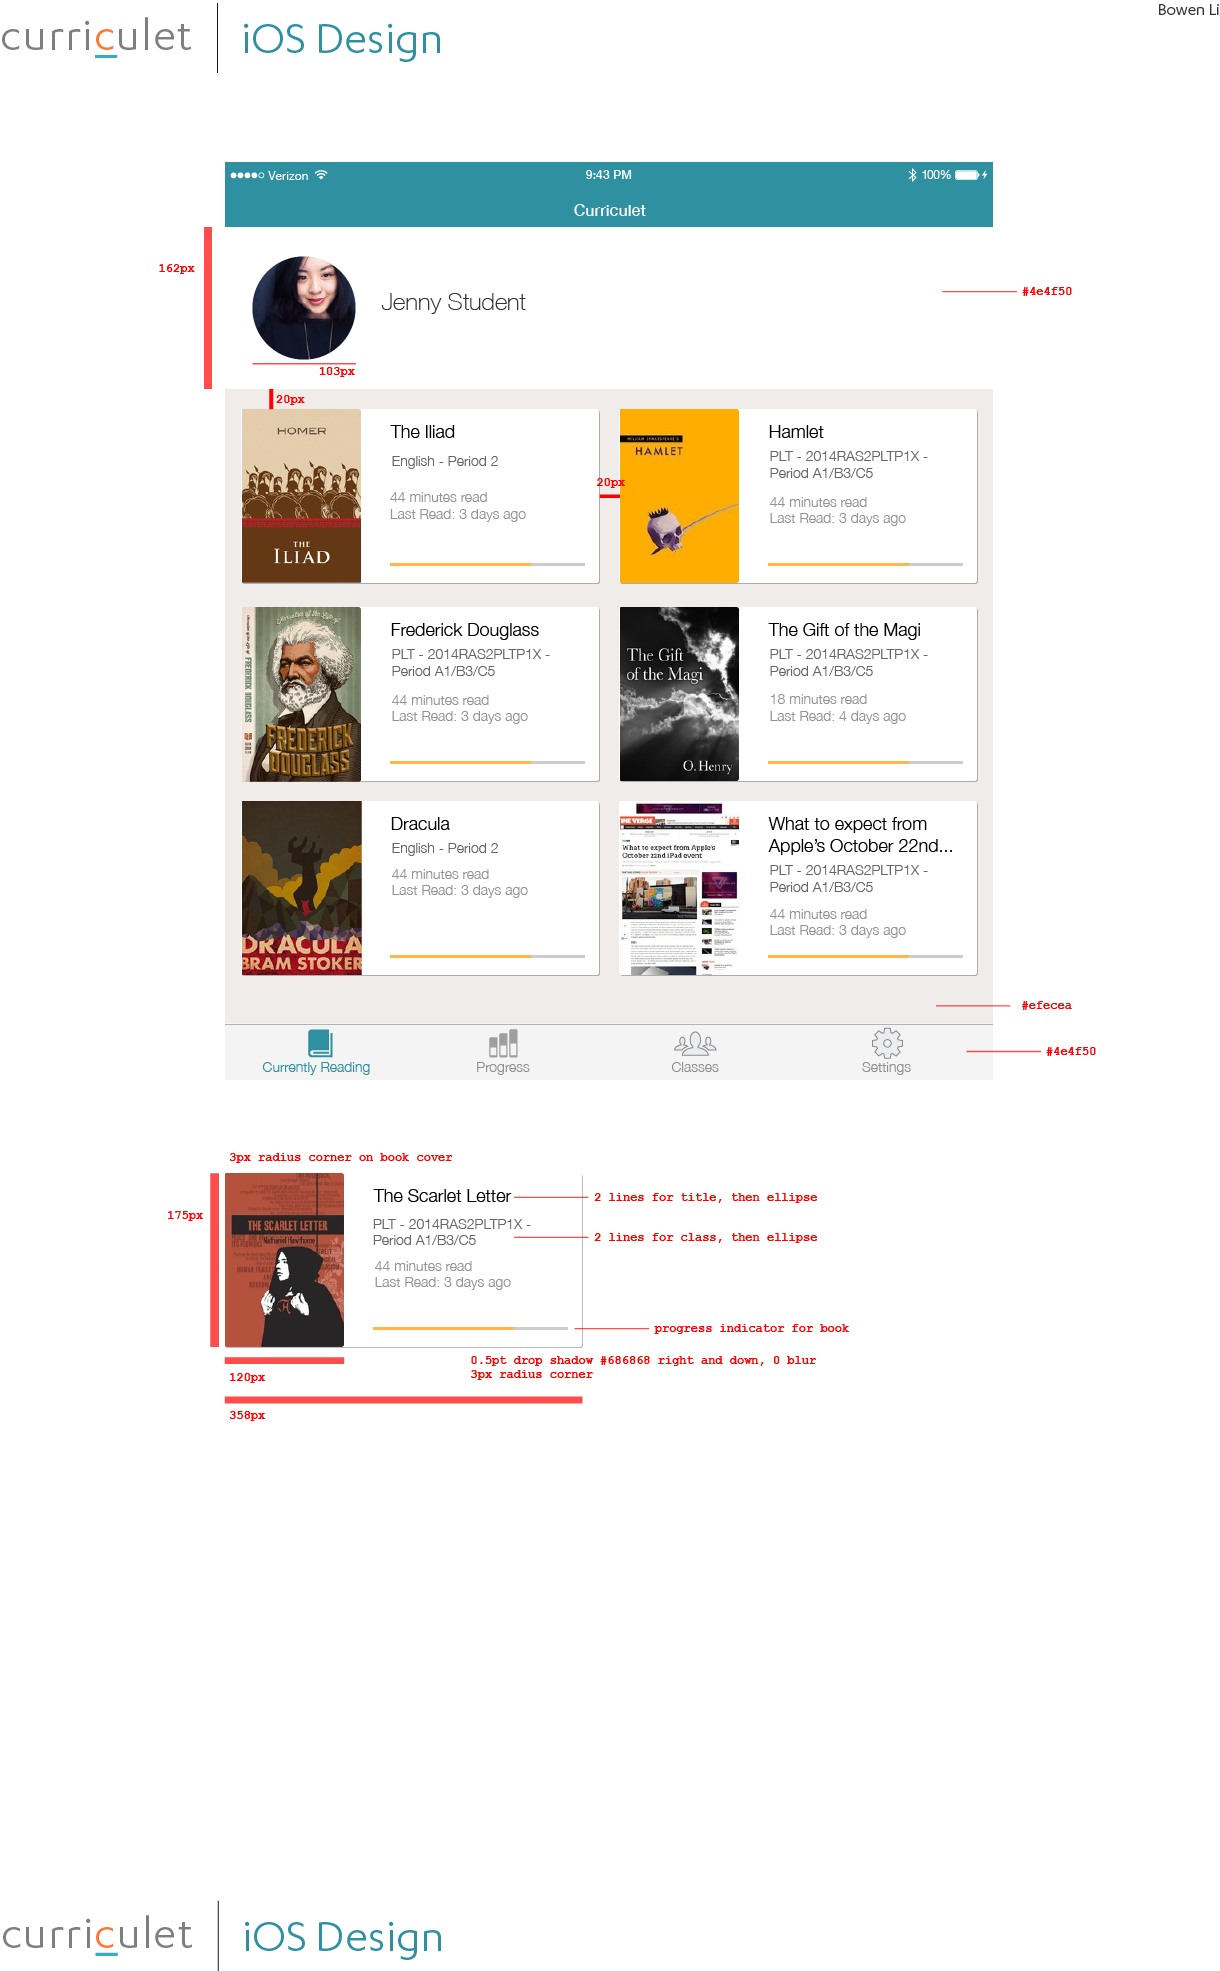
As the Head of Product and only designer, I shaped how the product works on every level. The following case study will be around Curriculet’s data & analytics functionality.

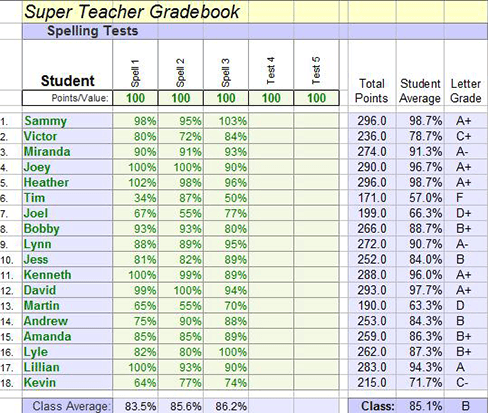
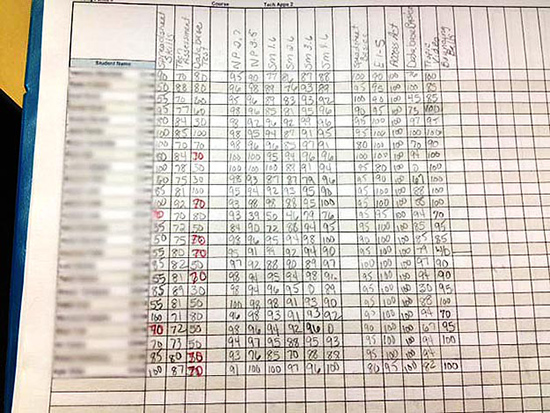
Designing a data product for English teachers is breaking new ground in education. The vast majority of English teachers still use tools and traditions that are hundreds of years old. My challenge as a designer was to work within this established tradition, while still providing undeniable value that helps teachers.

User

The primary user for the data project was English teachers for middle and high school.

Secondary users include principals and school administrators.

Research

Curriculet’s customers ranged from some of the most prestigious schools in the nation to small rural schools. To build a product that would work for a wide range of teachers, I needed to understand a range of workflows, motivations, and feelings around teaching.

To do my initial user research, I chose two very different teachers to focus on: A 10th grade English teacher at a charter school who was very data driven, and a 9–12th grade teacher at a small religious school who was feeling overwhelmed with all the data presented every day to teachers.

I spent many hours on the phone and in the classroom. I talked to students, teachers, and school administrators to understand the holistic view of how our product would be used in the context of the educational system. I supplemented my deep dives with additional video calls with teachers around the country.

Key Findings

As I talked to teachers, I discovered that almost all teachers have a few recurring moments in the school year where data is most important. These would be the times when Curriculet's data would make the most impact, and would shape the focus of the design.

Additionallly, some key themes were repeated throughout the schools that I talked to:

  • Teachers are increasingly expected by the school to make data-driven decisions and present quantitative reasons for assessing students.
  • Some English teachers embrace this and have set up their own systems for tracking student progress.
  • However, many English teachers find numbers to be intimidating. While they recognize the importance of data and can see that digital tools are bringing additional insight into education, they don’t feel comfortable diving into a screen full of data.

Metrics

The overall goal of Curriculet was to increase reading and language arts comprehension for the students while making teacher's lives easier. All our designs and features were built to support that mission.

For the data project, we expected to tighten the feedback loop for teachers and students on student performance and progress. This would manifest through usage of the data pages and occasional drilldown into specific areas. Because Curriculet is not a grading system, we expected that final input of grades would happen on the school's own LMS.

Designs and Iteration

Aside from presenting the raw data that teachers need for their gradebook, I designed higher order informational screens to help teachers make decisions about their students. This included “traffic light” indicators on an individual student, as well as the breakdown of concepts taught by classroom. This allows the teacher to quickly recognize where to focus instructional material vs individual time.

Because the teacher is trying to keep track of over 20 Literacy Standards for every student in the classroom, across dozens of assignments - having a rolled up view is crucial to making sense of the data.

Information Architecture

The information architecture of this product was set up around showing the appropriate data for the appropriate task. Our user wants to access the information on different time scales: weekly, monthly, and quarterly - each level representing a more engaged and comprehensive session. Weekly users must be able to quickly distill information and turn it around to use in classroom teaching, while monthly and quarterly access patterns show the need to be able to drill down deep into the data.

Final Designs

The final design incorporates all of the data Curriculet collects, broken down by individual students and by class averages:

  • Question and quiz scores
  • Reading time
  • Words Read
  • Standards ELA Literacy: Reading Informational Text
  • Standards ELA Literacy: Reading Literature
More Wireframes

The Data project was one of hundreds of features I designed at Curriculet.

Here is a sampling of some of the others.

Learn More

Questions? Comments? Get in touch with me.

Contact